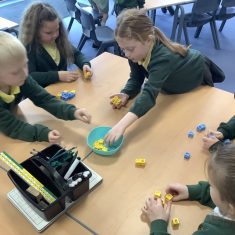
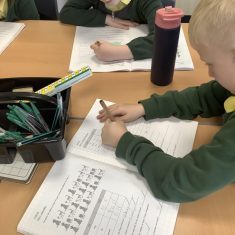
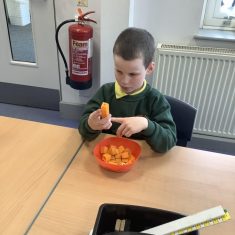
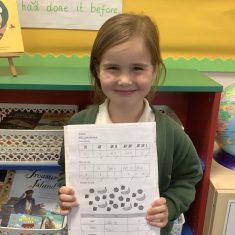
Year Two have been learning about statistics in Maths. First, they learnt about tally marks and how they can be used to help count up objects. They practised reading different tally marks and making them themselves. Then they were ready to put their knowledge into practise and make tally charts to count up objects.
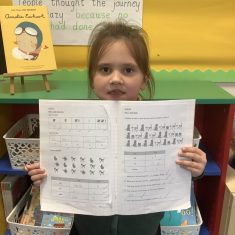
Next, the boys and girls learnt about tables. They found out that it is much easier to read the data in a table than in a tally chart. They were then able to use this data to answer different types of questions, including adding up and comparing different groups within the data set.
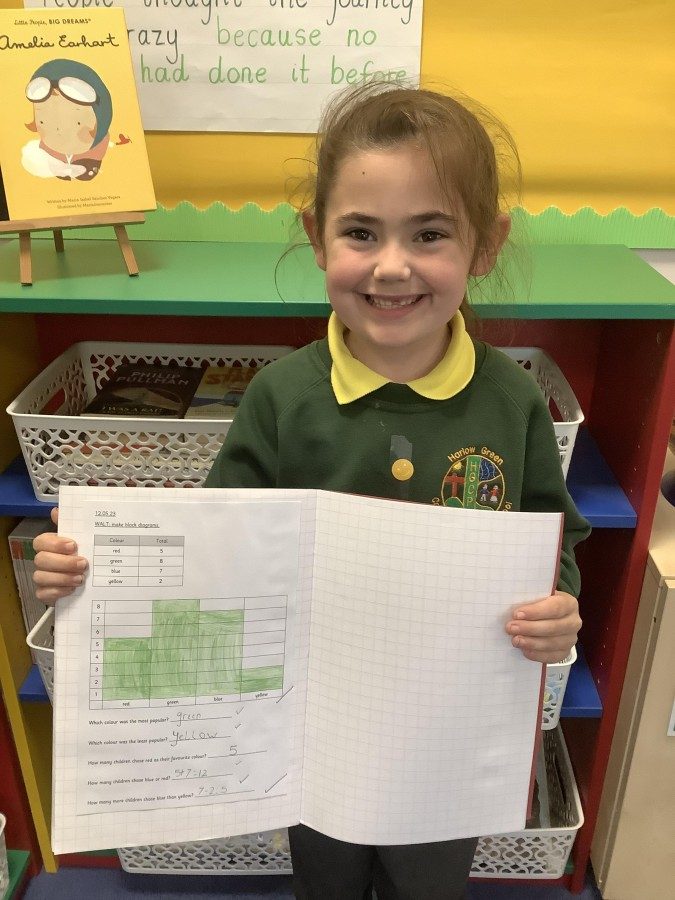
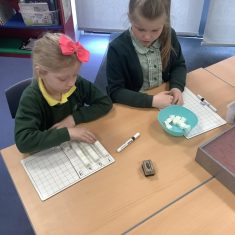
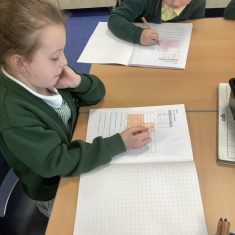
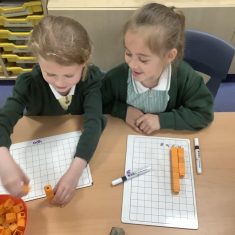
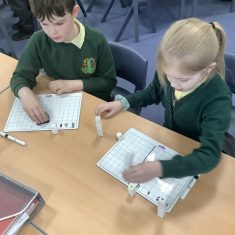
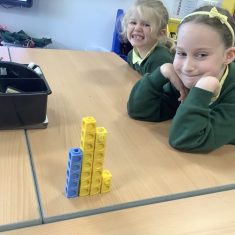
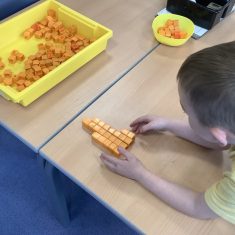
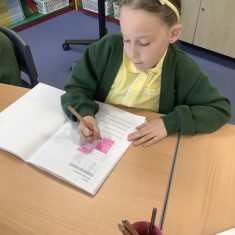
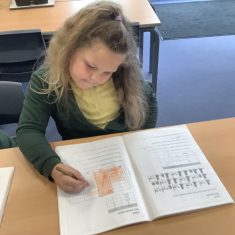
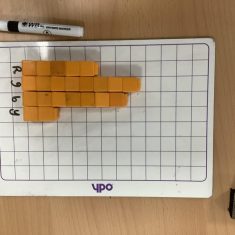
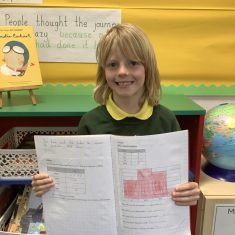
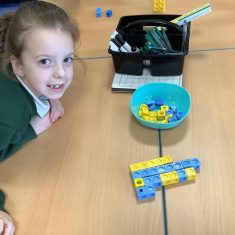
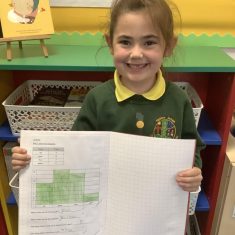
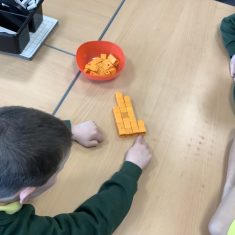
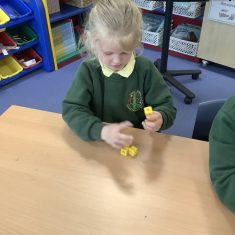
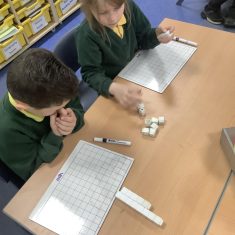
After that, the children learnt about block diagrams. They made their own block diagrams in small groups using cubes. Then they made block diagrams on paper, using a table to help them. Then, they answered questions about the block diagrams.
